# Store the IRIS data in a dataframe 'my_data'
my_data <- iris35 MANOVA and MANCOVA
35.1 Introduction
As we learned previously, multivariate analysis allows us to understand complex phenomena in sport by considering multiple variables simultaneously.
Two advanced techniques that allow us to do this are Multivariate Analysis of Variance (MANOVA) and Multivariate Analysis of Covariance (MANCOVA).
Both methods extend the principles of ANOVA and ANCOVA, respectively, to situations where there are multiple dependent variables. We’ll start by briefly revising ANOVA and ANCOVA.
Recap of ANOVA and ANCOVA
Anova
ANOVA is a statistical method used to compare the means of three or more samples (or ‘groups’) to determine if at least one sample mean is significantly different from the others.
Note
The term ‘sample’ is often used rather than ‘group’ to convey the idea that we might not be comparing different groups, but rather different samples from the same group over time. So rather than comparing the means of Groups A, B and C, we might be comparing the means of one group over three different periods (e.g. Sample A, B and C). I’ll use the two terms interchangeably in this section.
For example, we might want to explore whether there is a significant difference between the number of points scored between three different teams.
Team membership is the independent variable - e.g., Team A, Team B, Team C.
Number of points scored is the dependent variable…we hypothesise that it depends on your team membership.
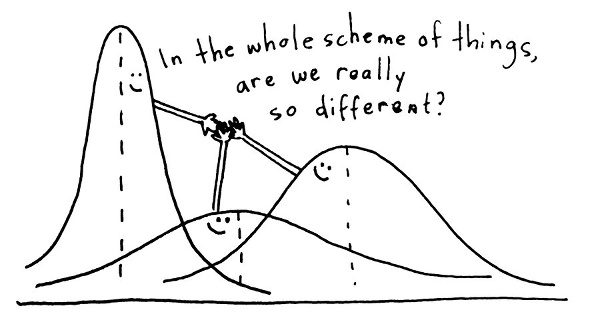
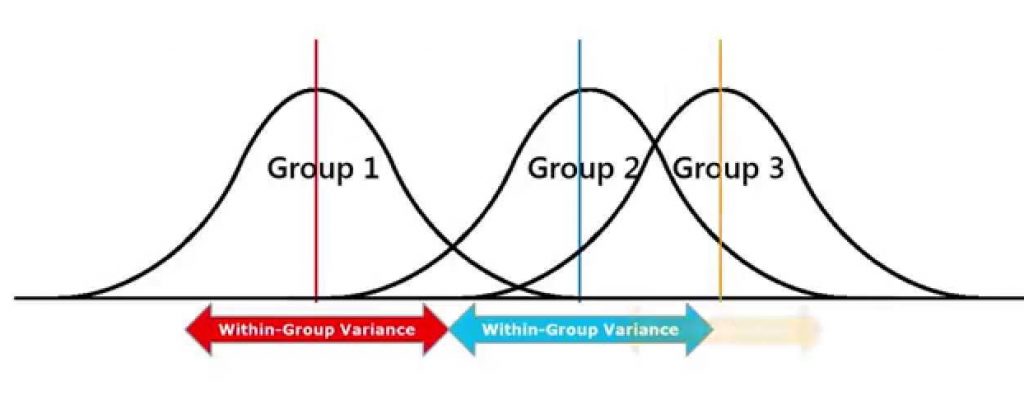
The analysis is accomplished by calculating the variance within each group and the variance between the groups. If the between-group variance is significantly larger than the within-group variance, it suggests that not all group means are equal.
ANCOVA (Analysis of Covariance)
ANCOVA, an extension of ANOVA, is a blend of variance analysis and regression that assesses for mean differences among groups while controlling for the variability of one or more covariates that may affect the dependent variable.
Tip
A covariate is a variable that is potentially related to the outcome of a study, but is not the primary focus. It’s included in the analysis to ensure that the results are more accurate, as it can account for some of the variation or differences that are not related to the main variables being studied.
This enhances precision by reducing error variance and adjusting for factors that might otherwise ‘skew’ the results. It’s particularly useful in quasi-experimental and observational studies (as are often found in sport) where random assignment is not feasible and potential confounding variables need to be accounted for.
The ‘problem’ with both ANOVA and ANCOVA is that they only deal with one outcome (dependent) variable. This is where MANOVA and MANCOVA become useful.
35.2 What is MANOVA?
MANOVA is used when we wish to test hypotheses about group or sample-based differences in the mean vectors of several outcome (dependent) variables at the same time.
It’s particularly beneficial when the dependent variables are correlated, and it can provide a more powerful test of group differences than separate ANOVAs.
Remember, when using ANOVA, we can only test for group-related differences in the mean of one dependent variable at a time.
To test for group-related differences in more than one dependent variable, we’d need to run separate ANOVAs for each variable, which can be problematic (see below).
MANOVA lets us test for group-related differences in the means of several dependent variables within one test, rather than running multiple ANOVAs.
For example, consider a study examining the effect of different training programmes on athletes. Instead of measuring the effect of each programme on a single attribute (as the case for ANOVA), MANOVA enables us to examine the combined effect on multiple performance metrics such as speed, endurance, and strength.
In this case, the training programme to which each athlete is assigned is the independent variable, and the things we measure are the dependent variables.
In this module, we are only covering one-way MANOVA. That is, looking at the influence of one independant variable (factor, or group membership) on several dependent variables.
You may also find use for a two-way MANOVA, which allows you to model multiple independent variables, as well as multiple dependent variables. However, this lies outside the scope of this module.
![]()
35.3 What is MANCOVA?
MANCOVA extends MANOVA by including one or more covariates. These are variables that are not of primary interest but may influence the outcome. By controlling for these covariates, MANCOVA can reduce the error variance and increase the sensitivity of the test for detecting true differences.
So we not only examine the importance of the grouping factor (like training programme) but we also take account of other variables that might be influential.
For example, if we continue with our study on athletes, we might use MANCOVA to control for variables like age or prior experience, which allows us to focus more accurately on the training programme’s effects.
Note that MANCOVA is not used when you have more than one grouping variable (factor) as an independent variable. This would be a situation in which a two-way MANOVA would be more appropriate.
35.4 Assumptions for MANOVA and MANCOVA
Before applying MANOVA or MANCOVA, certain assumptions must be met. You’ll note that some of these are the same as apply for the techniques we learned earlier in the module:
Independence of observations
Multivariate normality of the dependent variables
Homogeneity of variance-covariance matrices
Linearity and homoscedasticity
Violations of these assumptions can lead to incorrect conclusions.
35.5 Interpreting the Results
Interpreting the results of MANOVA and MANCOVA requires careful consideration.
The main output is a set of multivariate test statistics such as Wilks’ Lambda, Pillai’s Trace, Hotelling’s Trace, and Roy’s Largest Root. These determine if there are any statistically significant differences in the dependent variables across the groups.
If the test is significant, we proceed with post hoc tests to explore these differences further. It is important to report the effect size to understand the practical significance of the findings.
35.6 A Short Example of MANOVA
The following example uses the IRIS dataset that is built into R. We used this dataset earlier when exploring Discriminant Analysis.
This dataset has five variables, including a grouping variable Species.
Remember, the value of the MANOVA test is that it lets us explore group-based differences on more than one variable at a time.
In this case, we are interested in exploring whether there are significant differences in both sepal length and petal length between the different groups (species).
# MANOVA test
res.man <- manova(cbind(Sepal.Length, Petal.Length) ~ Species, data = iris)
summary(res.man)
Df Pillai approx F num Df den Df Pr(>F)
Species 2 0.9885 71.829 4 294 < 2.2e-16 ***
Residuals 147
---
Signif. codes: 0 '***' 0.001 '**' 0.01 '*' 0.05 '.' 0.1 ' ' 1These results suggest that there are significant differences between the groups. It doesn’t tell us whether these differences exist for all our variables and, of course, we want to see how the groups differ:
# Look to see how the groups differ
summary.aov(res.man)
Response Sepal.Length :
Df Sum Sq Mean Sq F value Pr(>F)
Species 2 63.212 31.606 119.26 < 2.2e-16 ***
Residuals 147 38.956 0.265
---
Signif. codes: 0 '***' 0.001 '**' 0.01 '*' 0.05 '.' 0.1 ' ' 1
Response Petal.Length :
Df Sum Sq Mean Sq F value Pr(>F)
Species 2 437.10 218.551 1180.2 < 2.2e-16 ***
Residuals 147 27.22 0.185
---
Signif. codes: 0 '***' 0.001 '**' 0.01 '*' 0.05 '.' 0.1 ' ' 1These results suggest that there are significant between-group differences on both variables that we entered into the analysis; sepal length and petal length.
35.7 Why not run multiple ANOVAs?
Hopefully, you’ll now understand that MANOVA and MANCOVA allow us to test for group-based differences on more than one dependent variable. You might be wondering why we’d use these techniques rather than simply running one ANOVA for each of the dependent variables.
Using MANOVA is like choosing a versatile, all-in-one tool. If you use multiple ANOVAs, you’re essentially applying a separate tool for each dependent variable, analysing each in isolation. This approach can be limiting because it overlooks the potential relationships and interactions between different outcome variables.
MANOVA, on the other hand, examines all these outcome variables simultaneously. It can uncover the connections and interactions between them. This is particularly beneficial when you suspect that these different outcome variables might influence each other.
For instance, in a study about athlete performance, using MANOVA would allow you to explore how various outcomes like speed and endurance might relate to each other in terms of performance, rather than examining each one in isolation.
35.8 Reading
The following is a recommended source for further reading on this, and other topics relating to multivariate statistics in R. It’s available via the module reading list on myplace.
- Zelterman, D. (2022). Applied multivariate statistics with R / [internet resource] (Second edition..). Springer.